
Individual Results

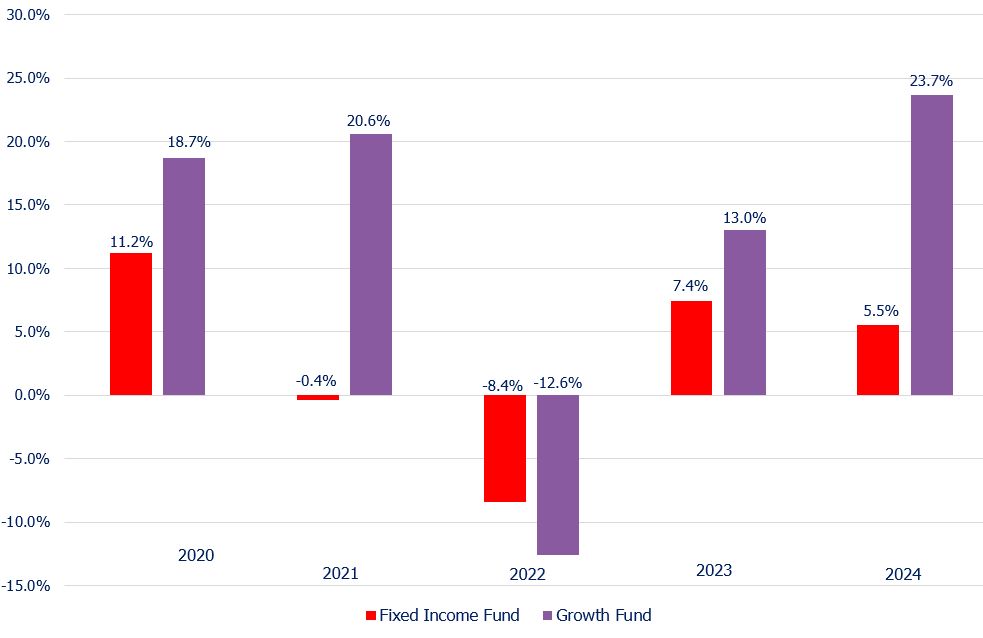
The return indicated on each member statement is a combination of the funds, based on that member’s balance in each, and the respective monthly earnings, less approximately 0.8% to 0.9% for plan expenses. Remember that assets in individual member accounts are allocated between these two funds based on the member’s age, so everyone will experience a slightly different combined return based on the allocation.

Investment Results

The investment returns posted here have been calculated and provided by Mercer. The returns reflect the investment results before netting against management, custodial and administrative fees.

2022  Performance Results

The following tables shows investment results from January 1 to December 31, 2022

ELCIC Pension Plan

ELCIC Pension Plan Return
Index Benchmark Returns
Excess Return
All Funds Combined
-11.6%
-8.8%
-2.8%

Growth Fund

ELCIC Portfolio Return
Index Benchmark Return
Fund Objective
CPI + 5%
Excess Return
PH&N Canadian Equity
-1.5%
-5.8%
+4.3%
RBC Global Equity Focus
-19.4%
-11.8%
-7.6%
Baillie Gifford Equity
-23.6%
-11.8%
-11.8%
Total Growth Fund
-12.6%
11.6%
-24.2%

Fixed Income Fund

ELCIC Portfolio Return
Index Benchmark Return
Fund Objective
CPI + 1%
Excess Return
PH&N Core Plus Bond Fund
-11.2%
-11.7%
+0.5%
Mortgage Pension Trust Fund
-5.1%
-4.0%
-1.1%
High Yield Mortgage
4.7%
-4.0%
+8.7%
Total Fixed Income Fund
-8.4%
7.3%
-15.7%

Four-Year Returns

The following tables show the rolling four-year results ending December 31, 2022.

Growth Fund

Growth Fund Investments
Four Year Rolling ELCIC Potfolio Return
Four Year Rolling Index Return
Four Year Fund Objective
CPI + 5%
Excess Return
PH&N Canadian Equity Value
11.7%
11.2%
+0.5%
RBC Global Focus
11.1%
10.6%
0.5%
Ballie Gifford Global Equity
8.8%
10.6%
-1.8%
Total Growth Fund
11.7%
8.7%
3.0%

Fixed Income Fund

Fixed Income Fund Investments
Four Year Rolling ELCIC Portfolio Return
Four Year Rolling Index Returns
Four Year Fund Objective
CPI + 1%
Excess Return
PH&N Core Plus Bonds
1.4%
-0.0%
+1.4%
Mortgage Pension Trust
1.3%
0.8%
+0.5%
High Yield Mortgage Fund
5.6
0.8%
+4.8%
Total Fixed Income Fund
1.8%
4.5%
-2.72%

Note: The various investments in the Growth fund have not been held for the entire four-year period. The results shown are the historical for those funds, but not the ELCIC Pension Plan.  However, the total Growth Fund result indicates the actual results for the ELCIC Pension Plan.

Notes

Benchmark

The benchmark is based on a model portfolio intended to achieve the investment objective with the appropriate risk and is used to measure the performance of the investment managaers.

Pooled Survey Median

This survey tabulates the results of all eligible investment managers.

ELCIC Pension Plan

Investment results are shown by fund in the bar chart and total plan returns are indicated in red for each year.

Note that all returns are before netting for expenses.